fig, (ax1, ax2, ax3) = plt.subplots(3, 1, figsize=(10, 9), sharex=True,
gridspec_kw={'height_ratios': [2, 1.5, 1.5]})
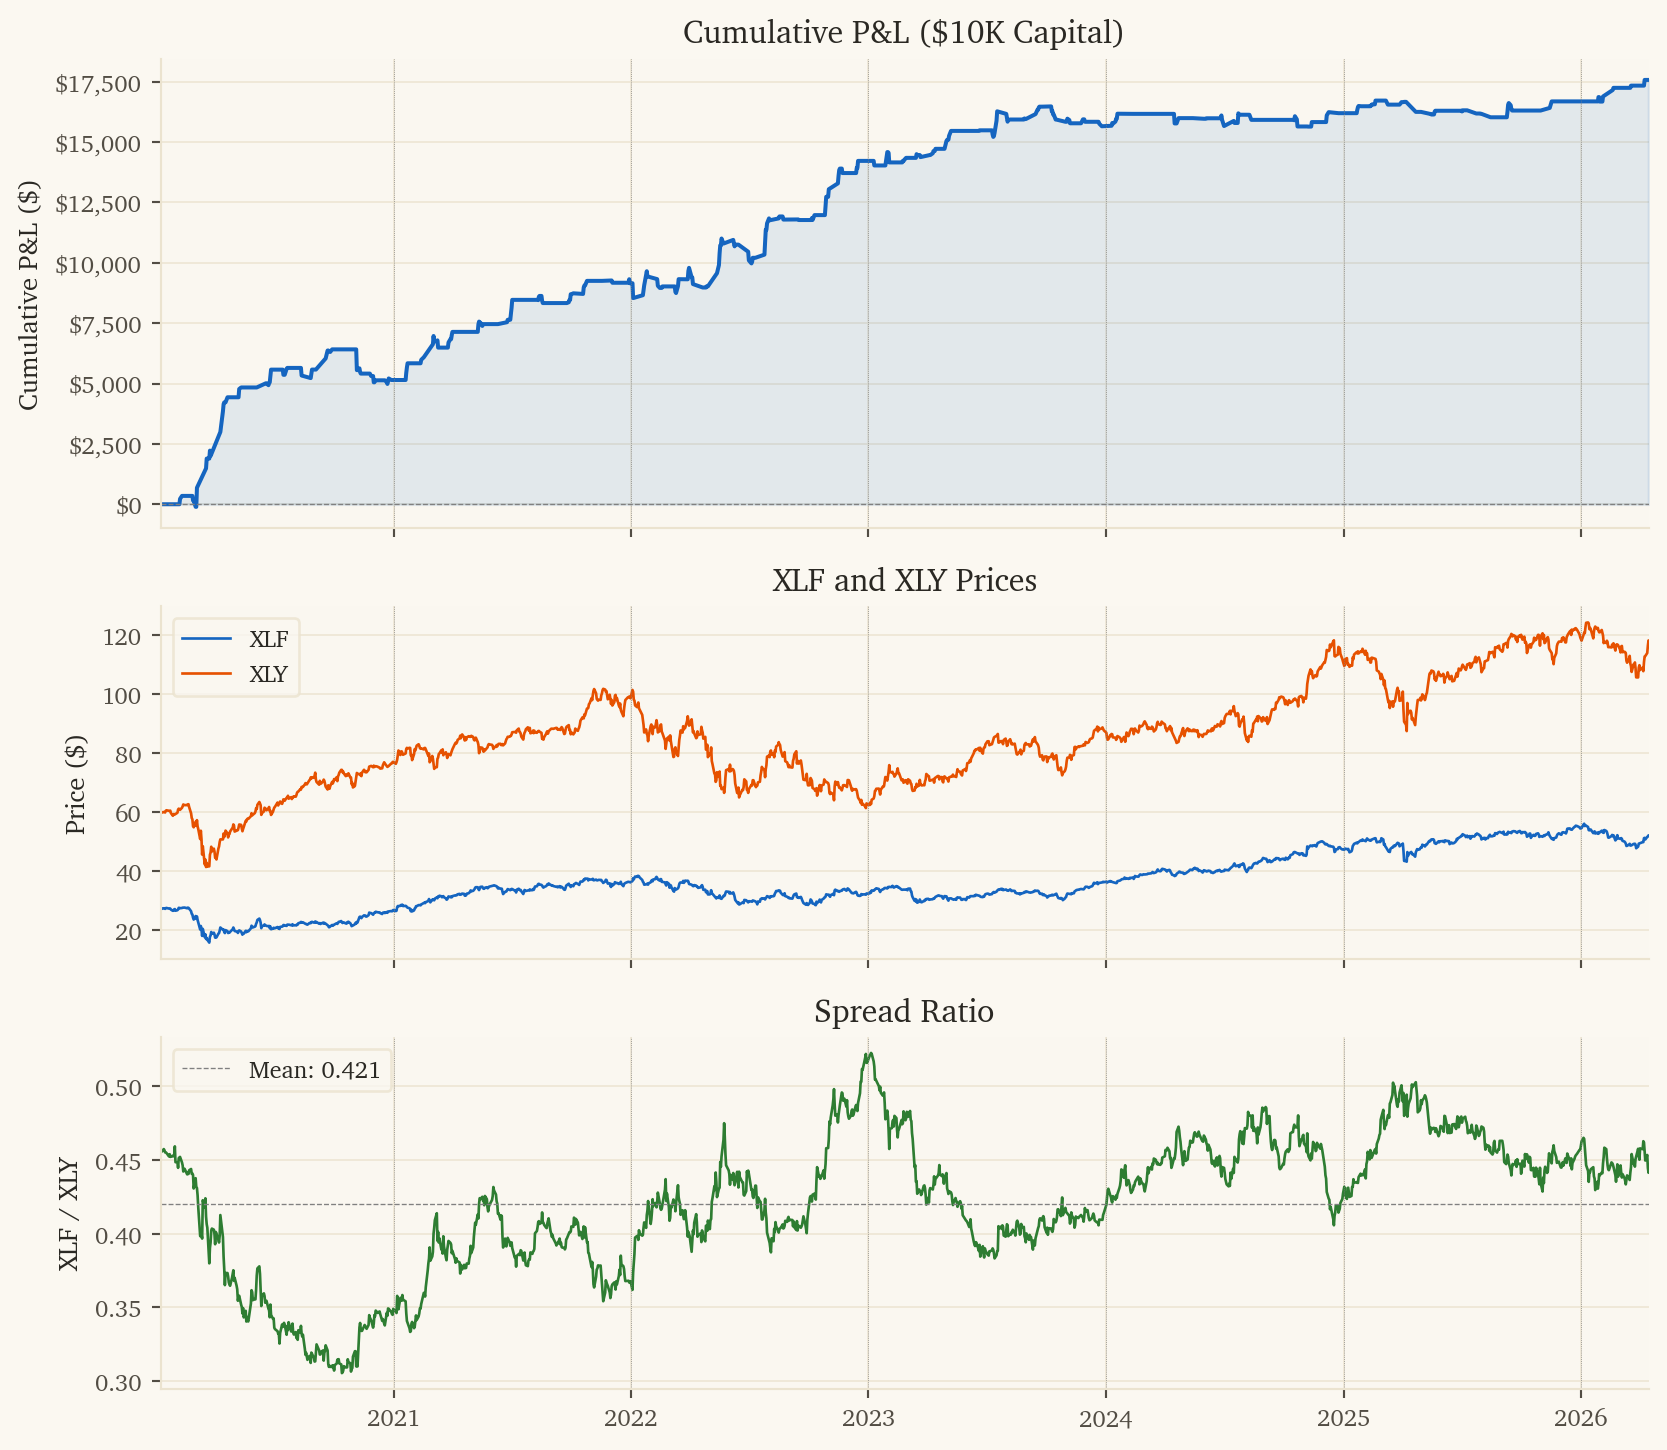
ax1.plot(df['dt'], df['cum_pnl'], color='#1565C0', linewidth=1.5)
ax1.fill_between(df['dt'], 0, df['cum_pnl'], alpha=0.1, color='#1565C0')
ax1.axhline(y=0, color='gray', linewidth=0.5, linestyle='--')
ax1.set_ylabel('Cumulative P&L ($)')
ax1.set_title('Cumulative P&L ($10K Capital)')
ax1.yaxis.set_major_formatter(plt.FuncFormatter(lambda x, _: f'${x:,.0f}'))
ax2.plot(prices['Date'], prices['xlf_close'], color='#1565C0', linewidth=1, label='XLF')
ax2.plot(prices['Date'], prices['xly_close'], color='#E65100', linewidth=1, label='XLY')
ax2.set_ylabel('Price ($)')
ax2.set_title('XLF and XLY Prices')
ax2.legend(loc='upper left', fontsize=9)
ax3.plot(prices['Date'], prices['spread_ratio'], color='#2E7D32', linewidth=1)
ax3.axhline(y=prices['spread_ratio'].mean(), color='gray', linewidth=0.5, linestyle='--',
label=f'Mean: {prices["spread_ratio"].mean():.3f}')
ax3.set_ylabel('XLF / XLY')
ax3.set_title('Spread Ratio')
ax3.legend(loc='upper left', fontsize=9)
for ax in [ax1, ax2, ax3]:
for yr in range(df['dt'].dt.year.min(), df['dt'].dt.year.max() + 2):
ax.axvline(x=pd.Timestamp(f'{yr}-01-01'), color='gray', linewidth=0.3, linestyle=':')
ax3.set_xlim(df['dt'].min(), df['dt'].max())
plt.show()